According to scientific research, the human brain processes images 60,000 times faster than text, and 90% of information transferred to the brain is visual. Bubble graphs, treemaps, bar charts, heat maps - a good data visualisation can do wonders if it delivers a story, no matter how complex, in an easy to digest format.
Data vis can be in the form of a static or interactive graphic - in fact, people have been using static data vis like charts and maps for as long as we can remember. Interactive data vis is a little bit newer, although it’s now becoming so universal that pretty much everybody has an understanding of what it is.
Due to its increase in popularity, content strategists are forever trying to find new and innovative ways to present data in visually appealing ways, as not only does it help find interesting angles, it also helps tell unique stories that people want to hear.
So on that note, here are some effective data visualisation techniques to keep in mind for your next content campaign.
1. Look for inspiration in the right places
If you’re new to data vis, the idea of sourcing data and designing a great piece of data vis from it can be daunting, to say the least. So, my advice? Look for resources online that offer instruction, guidance, and inspiration. Websites such as Information is Beautiful, Visualising Data and Flowing Data are just a few great sources of inspiration if you're on the lookout for creative data visualisation. Here's an example of a piece from Information is Beautiful:
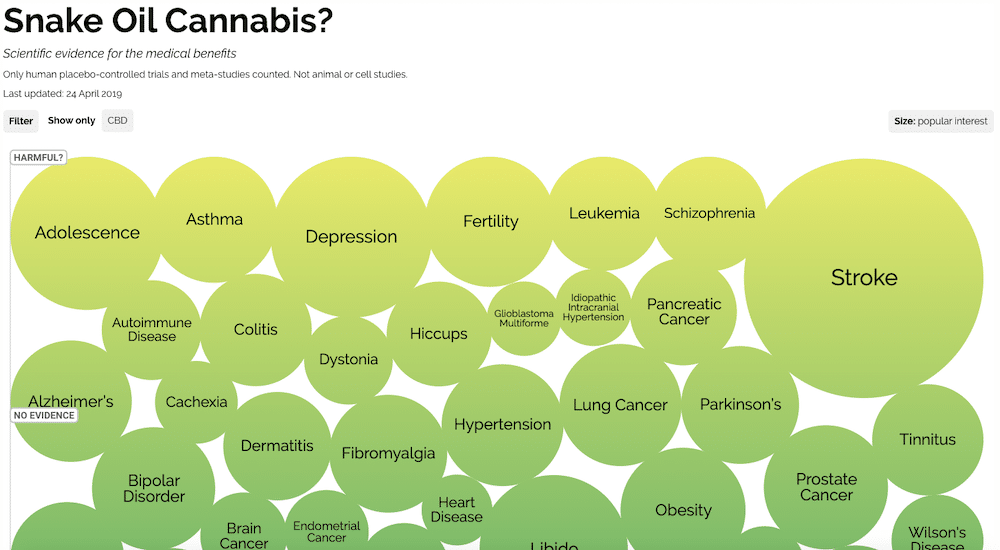
The Pudding also deserves a special shoutout and is my ultimate favourite website for data vis inspiration - make sure to check it out, you won’t be disappointed!
2. Keep it simple
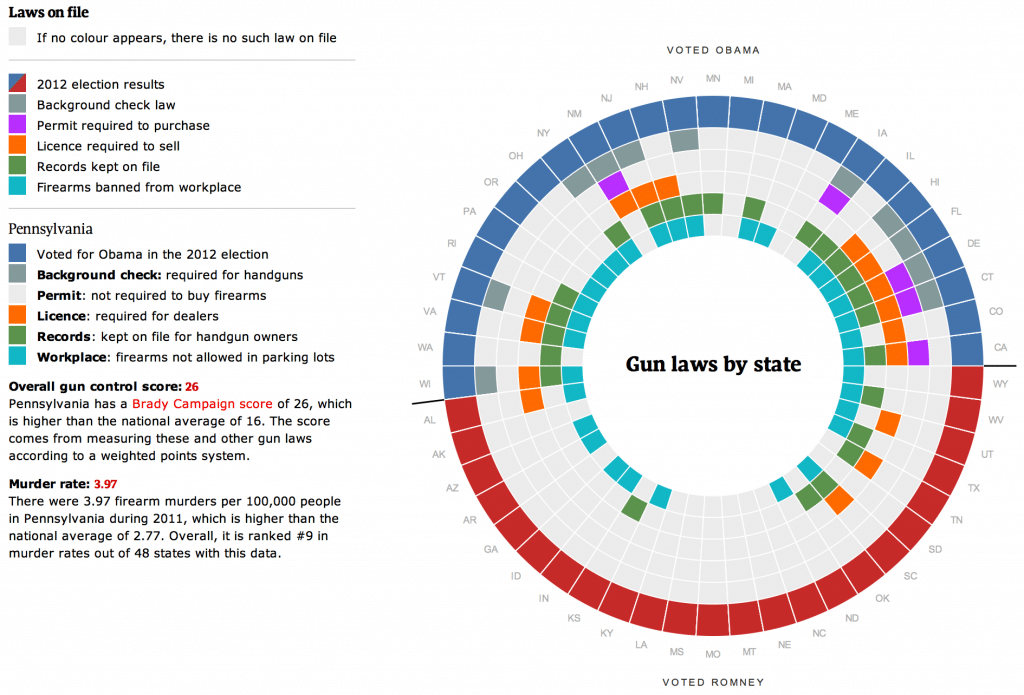
While many people think that the more complex a graph is, the better it is, the opposite is often true. Good data visualisation isn’t fussy or busy, and simplicity is much more credible. Data visualisation is all about making things easier to understand, therefore a good visualisation should simplify a message and make the main angles as easy to understand as possible, otherwise you could be left with a data visualisation like this.
For more on what not to do when it comes to creating data vis, check out these ugly charts.
3. Invest in data visualisation tools
Did you know there are tools online that can help you visualise your data in minutes? Here are just a few of the tools I’ve used in the past that I believe deserve a shout out:
- DataWrapper - Datawrapper allows you to copy and paste data from Google Sheets, Excel, CSV files, or link to URLs to create charts. You can then pick your chart from the selection on offer, and customise it to create effective data vis. What’s particularly useful with this tool is that it lets you preview and check how the chart will look like on different devices before publishing it.
- RawGraphs - With this tool, you simply copy and paste the relevant data directly from your spreadsheet, and choose a data visualisation type. Each metric can then be adjusted. This tool is ideal for beginners as it’s super easy to use.
- Tableau - Among the data visualisation tools available online, Tableau certainly stands out as one of the most advanced. It offers a 14-day free trial, but you will need to sign up for a subscription after that. Even if you don’t want to sign up, the site also offers many useful tips and insights on their blog so it’s certainly worth checking out.
4. Think mobile
If coming up with a good execution for a data vis piece wasn’t tricky enough, inevitably you will also have to decide how you want it to look on mobile. While it’s easy to think that designing for mobile is more difficult, you should think of it as an opportunity to present data in new and interesting ways. There are lots of techniques you could consider when it comes to creating data vis for mobile.
One of the most obvious things to do would be to scale down the graphic. However other options could be to spread your data horizontally on desktop but stack it vertically on smaller screens, introduce a zoomable visual on mobile or alternatively use an entirely different graphic, and focus on just the critical insights, whilst using the desktop version to reveal more context about the data.
5. Choose the right visualisation
Taking a look back over some of our most successful data-led campaigns, we've seen some trends emerging when it comes to successful types of data visualisations for generating links. Maps work well for a number of reasons, especially because they can open up outreach targets. Paddy also ran some data analysis for a talk he did a little while back at Learn Inbound and found that maps outperform any other content format - which you can see in his deck here.
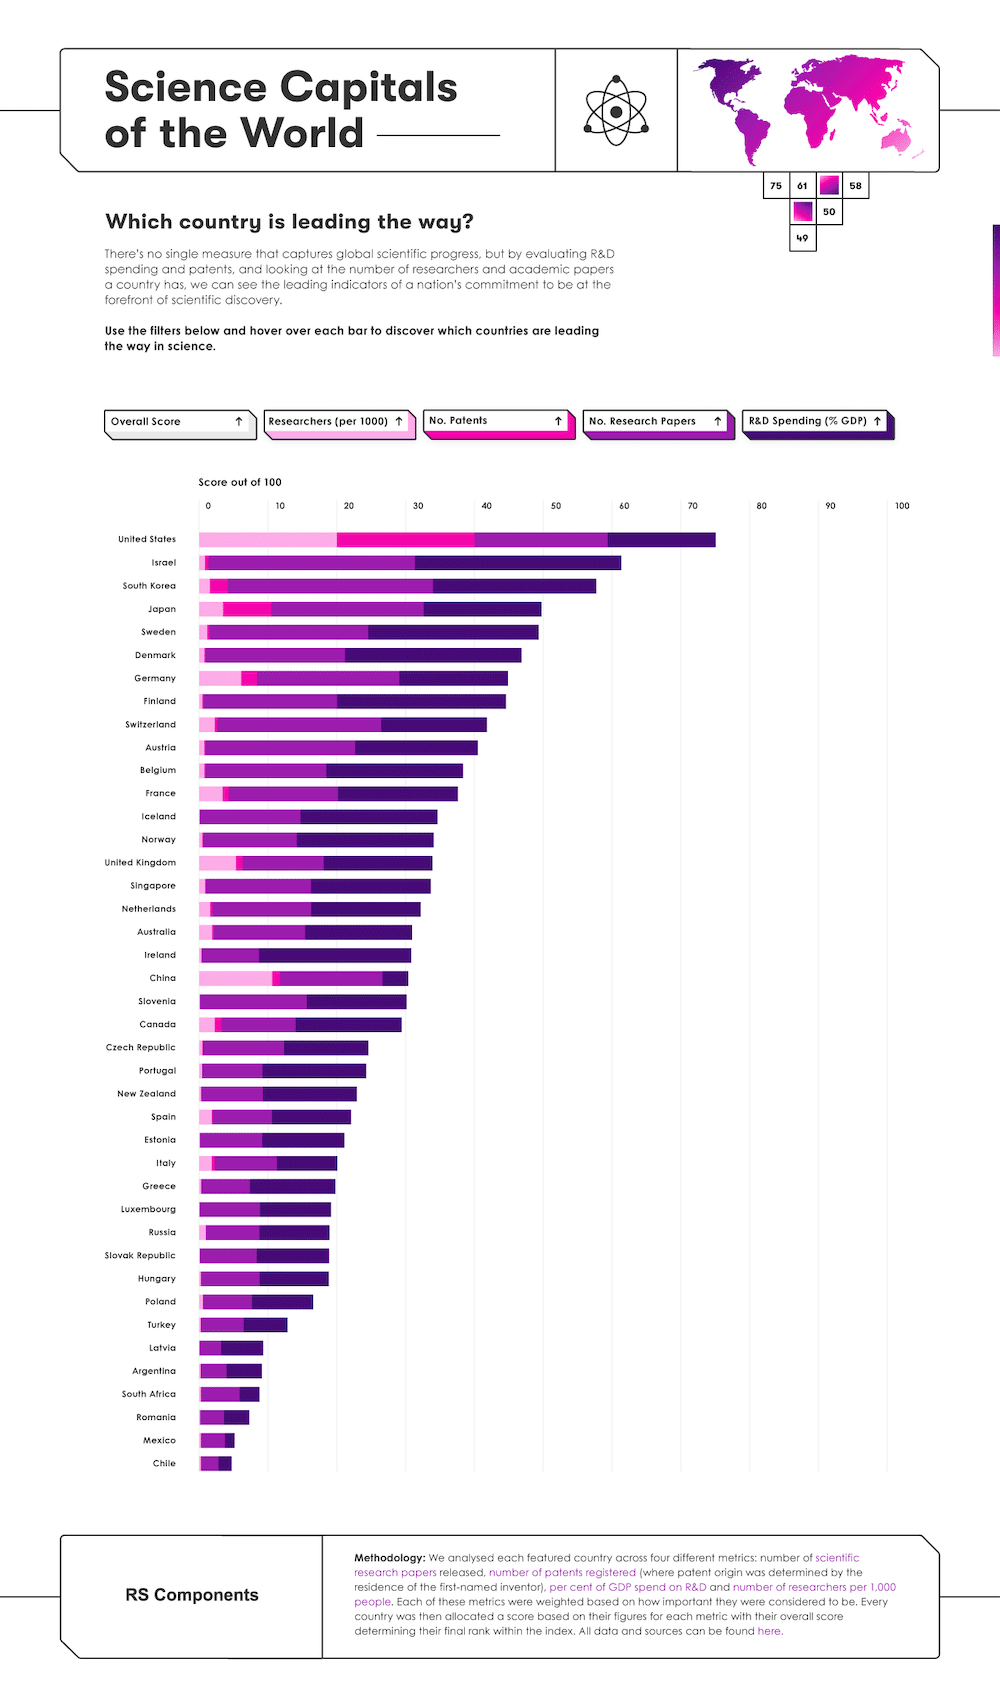
If you have lots of different metrics in your data, then an index might also come in useful. However, let’s not forget that sometimes less is more and it doesn’t always need to have interactivity. Static graphics and GIFs can work just as well. Take a look at this static piece we created for our client RS Components:
 Hopefully, these data vis tips and techniques are enough to get you started. Now it’s your turn!
For more inspiration, check out our post on data visualisation examples, or this piece on how to visualise data for a successful digital PR campaign.